Other Mid-Market
Everyone produces a report, and no two of them agree.
Distribution, manufacturing, professional services, and private equity portfolio companies arrive at the same place from different directions. Margins are thin enough to matter, operations span several locations, the systems do not talk to one another, and the monthly close depends on a set of spreadsheets that one person fully understands. The symptoms are consistent because the underlying cause usually is.

What we see most often
The same recurring problems seen across multiple businesses
Organizations that have outgrown their data foundations tend to arrive at a recognizable set of symptoms, and seeing three or four of them together usually says more about the stage you have reached than about anything your team has done wrong.
The spreadsheet has become the system of record
Whatever the ERP was purchased to do, the reporting that leadership actually reads lives in a workbook on somebody's desktop. The arrangement works until that person takes a holiday, moves on, or makes a copy-paste error that nobody catches for a quarter.
Each department defines the same metric differently
Finance, operations, and sales all produce a margin figure and each can defend the methodology behind it. Leadership meetings then become reconciliation exercises, and decisions get deferred a week so somebody can go and check the numbers again.
Software sprawl with nobody holding the map
A fifty-person company routinely runs twenty to thirty applications that cannot exchange data natively. Per-seat pricing then makes visibility expensive, so access gets restricted to a few managers and everyone else falls back to exporting files and rebuilding the analysis by hand.
AI pilots that never reached production
The demonstration was impressive, and then the system met your actual data and the answers stopped being trustworthy. More than 40% of agentic AI initiatives are forecast to be canceled by 2027, and the cause is far more often the data underneath than the model itself.
No executive actually owns the data
Technology owns the systems and finance owns the reporting, yet nobody owns whether the underlying data is correct. That gap is where the cost quietly accumulates, and closing it is the specific job a fractional data leader exists to do.
By the numbers
What the research shows.
61.4%
Of fractional-executive demand comes from small and mid-sized firms
$2M–$75M
Revenue band where fractional leadership fits best
>$5M
Annual cost of poor data quality at over a quarter of organizations
60–80%
Of analyst time spent building ad-hoc reports rather than analysis
What it costs to leave alone
None of this appears as a line item, which is a large part of why it persists for years. It surfaces instead as decisions made a week late, an analyst team that never quite reaches analysis, software you are paying for twice, and a management team that has quietly stopped trusting its own dashboards. Each of those is survivable on its own, and together they set a ceiling on how fast the business can move.
The question everyone asks
“Why can't we just use ChatGPT, Claude, or Gemini for this?”
A general-purpose model has no knowledge of how your business defines a customer, a unit, or a margin. Pointed at fragmented data it will produce fluent, confident answers faster than anyone can check them, which is a worse position than having no answer at all. The constraint has never really been the tool; it is the definitions, the ownership, and the pipelines underneath it.
We use these tools every day and they make us considerably faster, which is exactly why we are careful about where they belong in your business. A model supplies capability, and somebody still has to decide what to automate, demonstrate that it is safe, and answer for the outcome when a regulator or a board asks.
The first 90 days
What happens once we start.
The first quarter is deliberately front-loaded so you can judge the engagement early. The first month establishes what is actually happening, the second is aimed at savings that cover the cost of the work, and the third sets direction your board can approve.
Days 1–30
Diagnostic
- Data and application inventory across every site and function
- Establish where reporting disagrees, and why it does
- Software spend and license audit
- Interview the people actually maintaining the spreadsheets
Days 31–60
Quick wins
- One certified definition per critical metric, published and agreed
- Reduce redundant software spend
- Automate the most painful manual report first
- Name an accountable owner for each data domain
Days 61–90
Roadmap
- Target data architecture sized to your business rather than an enterprise
- Sequenced automation and AI use cases with expected payback
- Governance cadence designed to survive the end of the engagement
- Capability transfer plan for your internal team
The objection we hear most
“We already have an IT provider.”
You probably should keep them, because a managed service provider keeping your infrastructure running is valuable work. It is also a different job from deciding what your data architecture should be, arbitrating between departments on definitions, and holding vendors to account on your behalf. The fractional seat sits on your side of the table, which is the position nobody currently occupies.
Proof
Work in other mid-market.
Client names are withheld where confidentiality requires it. Each engagement sets out the business problem, the technical approach, and what it produced.
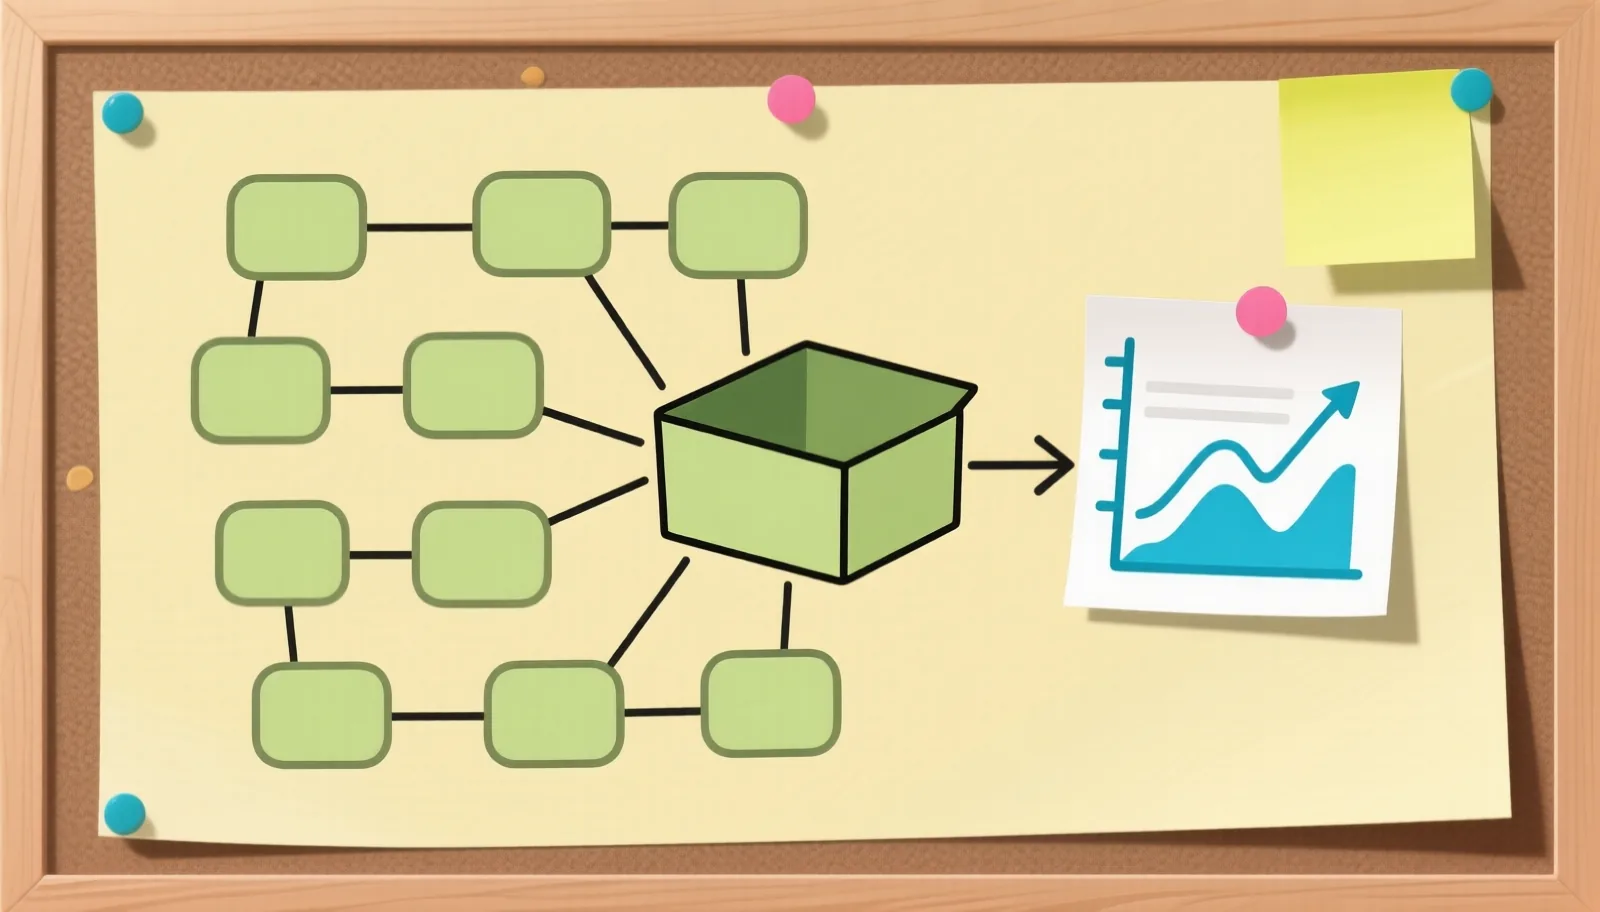
Replacing 35 disconnected systems with one analytics platform
National uniform and facility services company
A nationwide services business was running on 35 disconnected systems, which meant no comprehensive view of performance, invoice disputes that extended the cash collection cycle, and a reporting function that consumed enormous manual effort. Consolidating onto a governed Azure platform cut reporting labor by 70% and delivered around $12M in annual savings.
- Annual cost savings from efficiency and predictive analytics
- $12M
- Annual cost savings from efficiency and predictive analytics
- Reduction in manual reporting labor
- 70%
- Reduction in manual reporting labor
- Improvement in data accuracy against a single source of truth
- 95%
- Improvement in data accuracy against a single source of truth

Unifying student data across 125,000 learners on Google Cloud
Remote learning institution
A remote learning institution serving more than 125,000 students generated rich data across student information, learning management, and curriculum systems, none of which spoke to each other. A governed BigQuery and Looker platform brought those streams together to support early intervention, faculty insight, and executive reporting.
- From project initiation to full production deployment
- 20 weeks
- From project initiation to full production deployment
- Students covered across integrated systems
- 125,000+
- Students covered across integrated systems
- Dashboard tiers from executive to student success advisor
- 4 personas
- Dashboard tiers from executive to student success advisor
Further reading
Writing relevant to this sector.
Published commentary covering the questions that come up most often in these conversations. Each opens the full article on Medium.

Let's talk about your other mid-market problem.
Half an hour is usually enough to establish whether fractional leadership suits where your business currently sits, and you will get a straight answer either way. There is no obligation attached, and no proposal unless you ask for one.