The situation
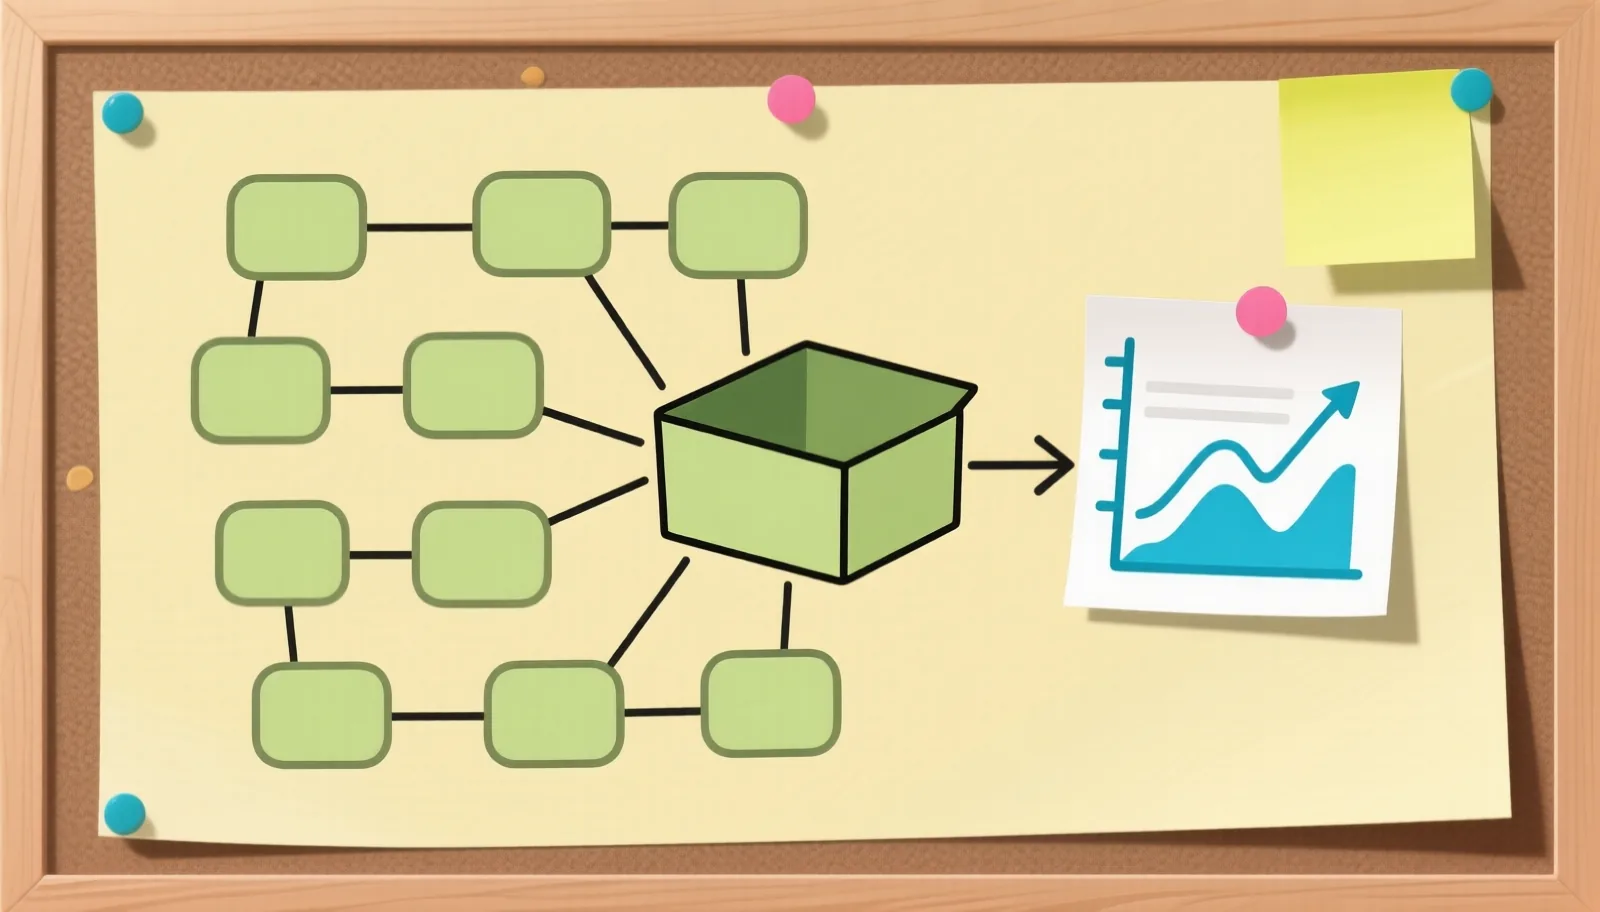
A nationwide uniform and facility services business had grown into an estate of 35 disconnected systems. The consequences were felt well outside the technology function.
- No comprehensive view of performance. Critical data sat in departmental systems with no standardized integration, so nobody could see the business whole.
- Manual reporting at scale. Teams extracted data by hand, rebuilt reports in spreadsheets, and reworked numbers, which introduced error and steadily eroded confidence in the metrics.
- Invoice disputes. Disconnected billing and service systems produced frequent invoice matching errors, generating disputes and extending the cash collection cycle.
- Reactive customer management. Without integrated data the company learned about service problems when customers complained, and missed cross-sell opportunities entirely.
The approach
A governed foundation. An Azure Data Lake capable of ingesting structured and unstructured data from all 35 sources, with governance policies and security controls established at the outset rather than retrofitted.
Pipelines that standardize as they load. Azure Data Factory pipelines carried validation, cleansing, and standardization, so that inconsistent definitions across ERP, CRM, and operational systems resolved into one agreed meaning per entity.
Analytics for two different audiences. Tableau delivered pre-built executive and departmental dashboards alongside self-service capability for business users, while Databricks supported the predictive work: churn prediction, demand forecasting, cross-sell identification, and route optimization for service delivery.
The outcome
- $12 million in annual savings, through operational efficiency and the predictive analytics the platform made possible.
- 70% reduction in manual reporting labor, as automated dashboards and self-service replaced hand-built extracts.
- 95% improvement in data accuracy, once a single source of truth removed the version-control disputes.
- Near real-time refresh, which changed the tempo of decision-making across the leadership team.
What made it work
The program never attempted a single large cutover. It ran in phases beginning with core financial reporting and expanding into operational analytics and machine learning, with every phase designed to deliver something measurable. Business stakeholders sat inside the delivery team and evaluated each technical decision against operational impact, and change champions in each department carried adoption further than any training program would have on its own.